
Stop looking at CPU Usage. Start looking at Pressure.
Why "100% CPU" doesn't mean your server is dead.

I have two servers running in production right now.
Server A is at 100% CPU. The app is responsive, latency is low, customers are happy.
Server B is at 40% CPU. The API is timing out, SSH is laggy, on-call is getting paged.
If you look at standard dashboards (Datadog, CloudWatch, top), Server A looks like the problem.
You might even have auto-scaling set to add more nodes when CPU hits 80%.
But Server A is fine. It’s just efficient. It’s a background video encoder using every cycle it paid for.
Server B is the real disaster. It’s suffering from resource contention.
We’ve all been trained to stare at “usage” metrics (CPU%, load average) and treat them as system health. For automation, these metrics are dangerous. They tell you how busy a resource is, not how stressed the system is.
For the kind of circuit breaker I’m building in Linnix, “busy” is not enough. I need to know when the system is actually stalling. That’s where PSI (Pressure Stall Information) comes in.
The problem with “usage”
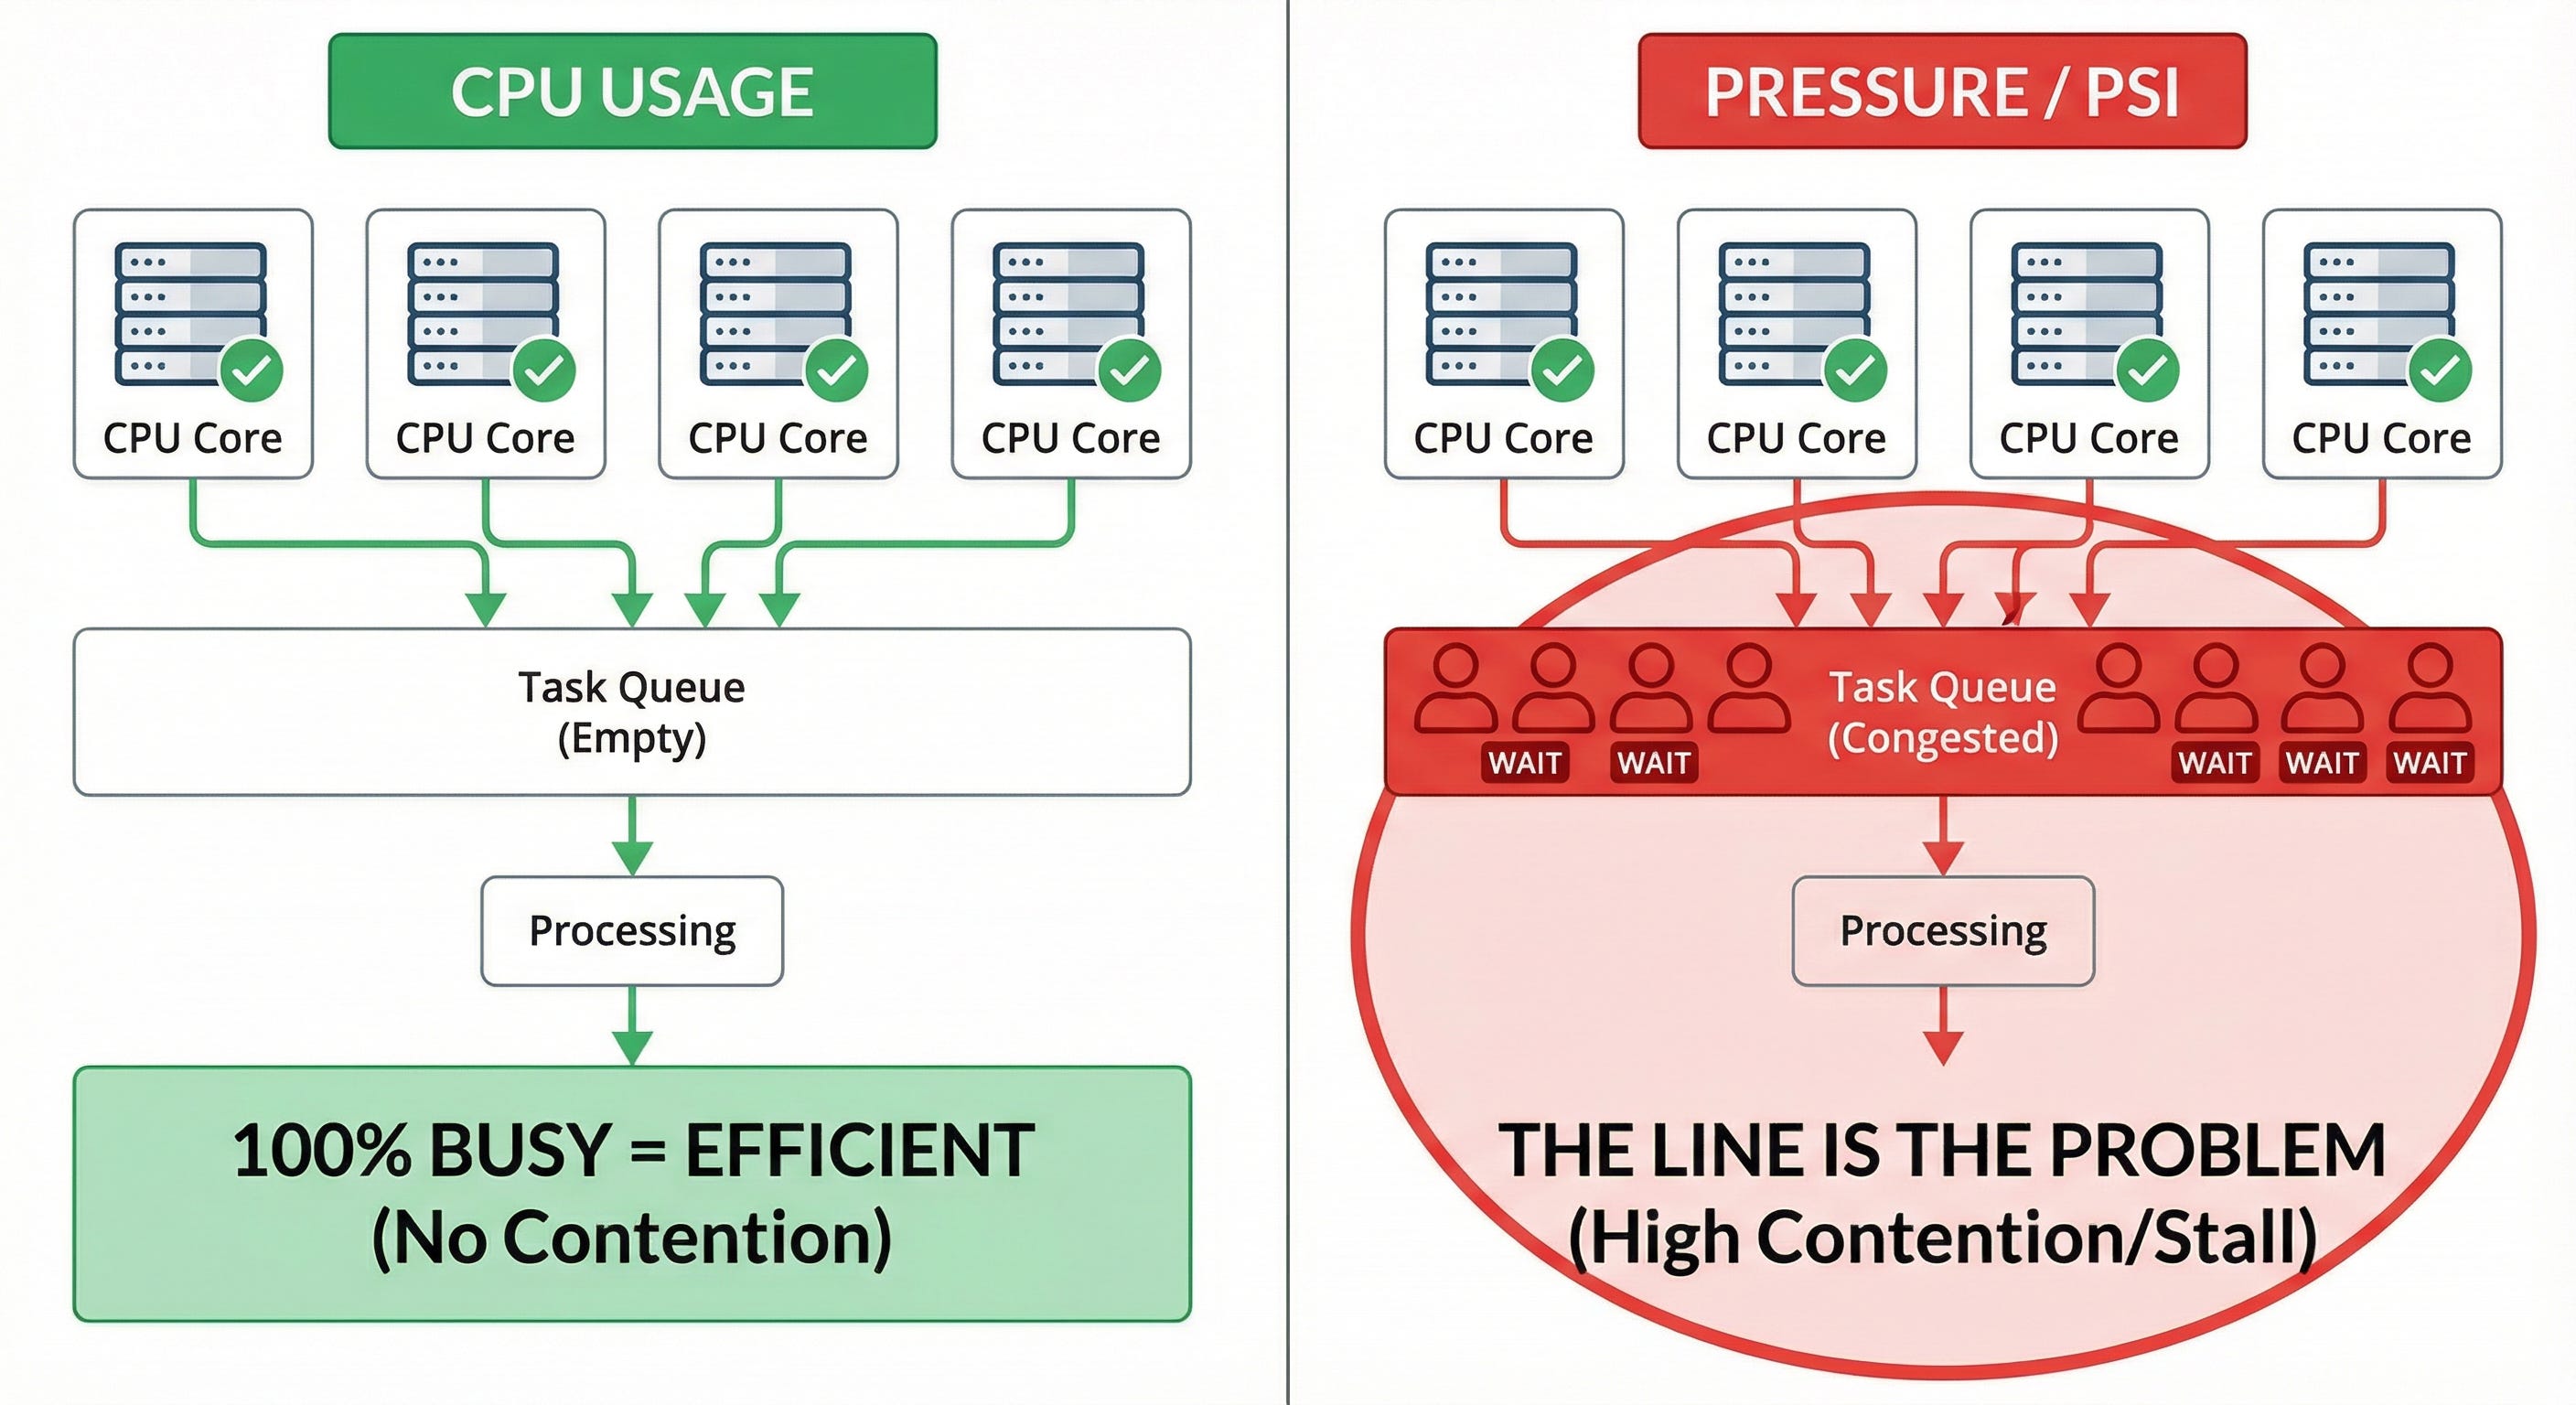
Imagine a grocery store with 4 checkout lanes.
Scenario 1:
All 4 lanes are active, scanning items. No one is waiting.
Usage: 100%
Customer experience: perfect (no waiting)
Scenario 2:
All 4 lanes are active. There are 20 people angry and waiting in line.
Usage: 100%
Customer experience: terrible (long waits)
“CPU usage” only measures the cashiers. It doesn’t measure the line.
If I write a script like “kill processes when CPU > 90%”, I will kill the efficient worker in scenario 1. That’s why most auto-remediation logic is risky. It’s built on the wrong signal.
Enter Pressure Stall Information (PSI)
In 2018, Facebook/Meta engineers had this exact problem. They wanted to pack servers tightly to save money, but they needed a signal that told them when “packed” became “overloaded”.
They added PSI to the Linux kernel (4.20+).
Instead of measuring “how busy is the CPU?”, PSI measures:
how much time tasks spend waiting because the resource is congested.
You can see it on any recent Linux box:
cat /proc/pressure/cpuYou’ll also find:
cat /proc/pressure/memory
cat /proc/pressure/io
How to read it (“some” vs “full”)
The PSI files give you rolling averages, like:
some avg10=0.00 avg60=0.00 avg300=0.00 total=0For CPU you usually only see some. For memory and I/O you get both some and full.
Roughly:
some: in the last 10/60/300 seconds, what percentage of time was at least one task stalled waiting on that resource?full(for memory/IO): in the last 10/60/300 seconds, what percentage of time were all runnable tasks stalled?
A simple way to think about it:
some→ feels like tail latency (P99). “Sometimes someone is waiting in line.”full→ feels like throughput loss. “Everyone is stuck, the system isn’t making progress.”
So if avg10 for CPU some is 5.00, it means that in the last 10 seconds, for 5% of the time at least one task was stalled waiting to get CPU time.
That’s much closer to “user feels lag” than raw CPU%.
Why I’m using PSI for Linnix
I’m building an automated circuit breaker for Linux as part of Linnix.
Goal: detect a runaway process (fork bomb, memory leak, bad cron, etc.) and kill it before the server falls over.
If the trigger is CPU usage alone, it’s guesswork. It’s easy to kill the “good citizen” that’s just busy.
If the trigger is PSI, it’s based on actual stall time.
A simple rule looks like this:
if CPU usage > 90% and CPU PSI
some> 40 → treat this as “unhealthy”
The idea:
I don’t care if you use a lot of CPU.
I care if you are causing others to wait a lot for the CPU.
So Server A (100% CPU, low PSI) is fine.
Server B (40% CPU, but high PSI) is the one I want to investigate and maybe kill a process on.
How to use this when debugging
If you’re debugging latency:
Don’t rely only on load average. It’s a mix of runnable tasks, I/O waits, and uninterruptible sleeps. It’s not a clean signal.
Check
/proc/pressure/cpu.
Ifavg10is high, a big part of your latency is coming from scheduler pressure, not just “slow code”.Check
/proc/pressure/io.
If that’s high, your database / disk / logging path is likely causing stalls, even if CPU usage looks low.
CPU% is still useful, but more as context than as the main decision metric.
What’s next
Next week I’ll share some Rust code from the circuit breaker in Linnix:
how I read PSI from
/proc/pressure/*how I combine it with other signals (fork rate, short-lived jobs)
and how I make “kill vs don’t kill” decisions in milliseconds without flapping
If you’re still using only CPU% and load average to drive automation, this is probably a good time to add PSI to your toolbox.